
Table of Contents
Introduction
As an exercise in multiclass logistic regression, k-means clustering and principal component analysis, I generated a prediction model on the famous IRIS data set, to classify the flowers based on sepal and petal characteristics into one of three categories.
Data
The Iris flower dataset is a famous data set used in machine learning classes. More information on the data can be found on the wikipedia page.
The data contains 150 rows with the petal length and width, and sepal length and width of each individual flower. It is split 50/50/50 between the three types of Irises: Setosa, Versicolor and Virginica. The aim of the exercise is to create a model that can accurately cluster the flowers into the three categories.
Model 1
Multiclass Logistic Regression and K-means Clustering
I first tested a linear boundary between the three classifications, after conducting a multiclass one-vs-all logistic regression on the data.
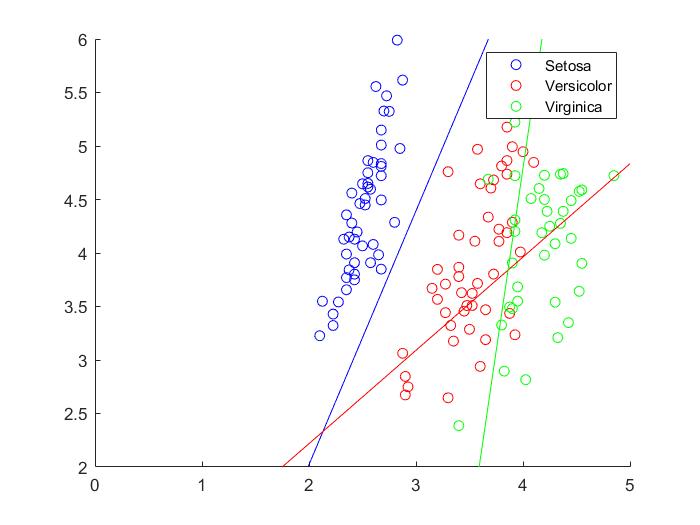
Since we know the true classification, we can test our model accuracy using a confusion matrix.
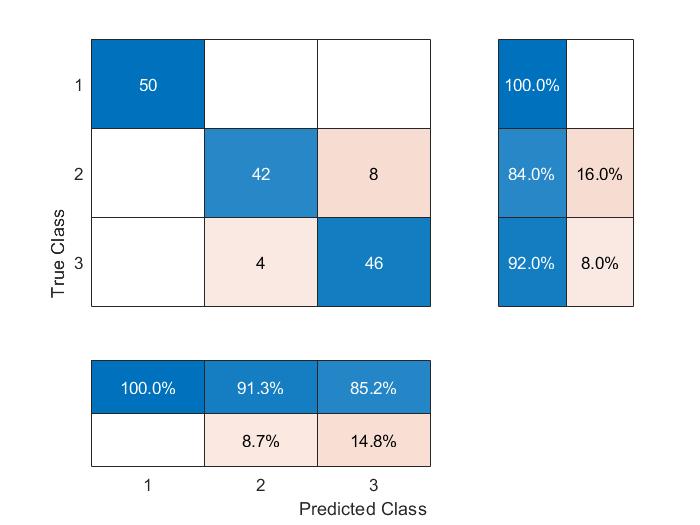
Per the confusion matrix, our classification is fairly accurate, with prediction accuracy for the model at 92%.
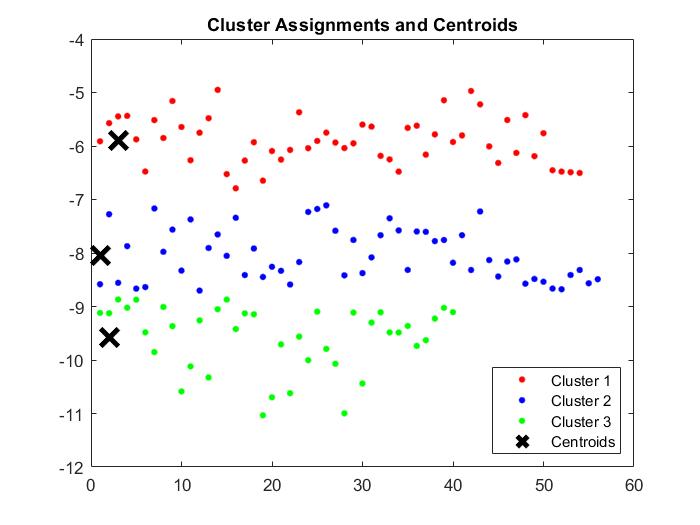
The next model tested was through using k-means clustering to group the data points. I derived optimum k = 3 through the elbow method. Post clustering, the results are as below:
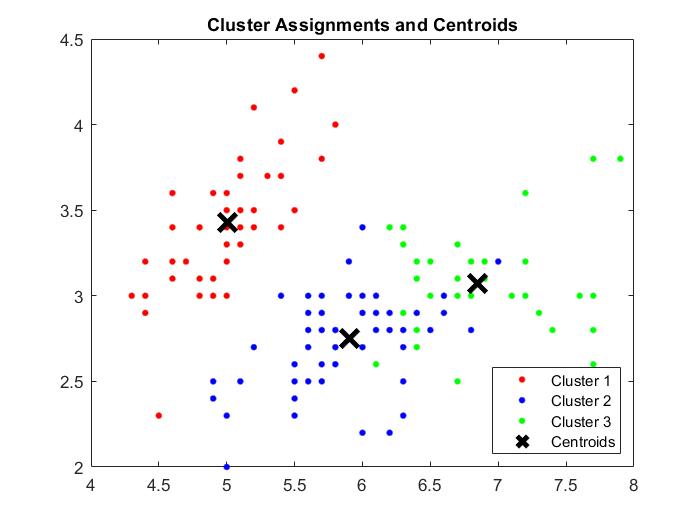
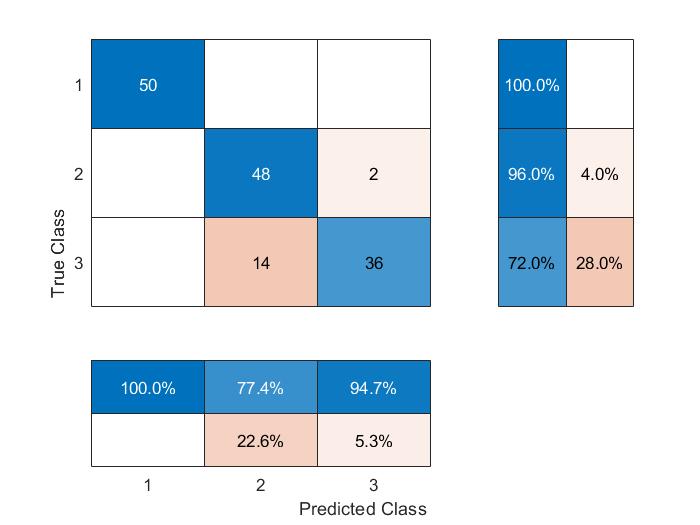
Model accuracy is slightly lower at 89.3%. The chief areas of inaccuracy are between classifications for Versicolor and Virginica.
Model 2
Principal Component Analysis
I also conducted a principal component analysis on the dataset. The respective variances explained by each component are below:
Variance explained by principal component 1 = 80.59%
Variance explained by principal component 2 = 14.92%
Variance explained by principal component 3 = 2.91%
Variance explained by principal component 4 = 1.58%
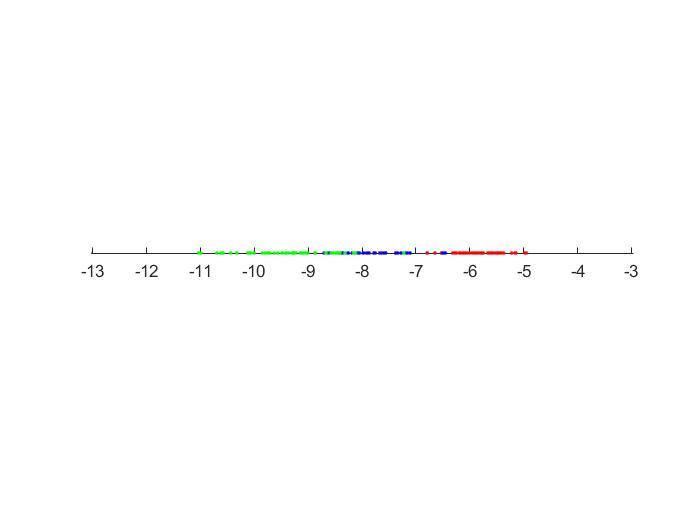
Graphically, post PCA component reduction, we see the below representations:
For 1 component:
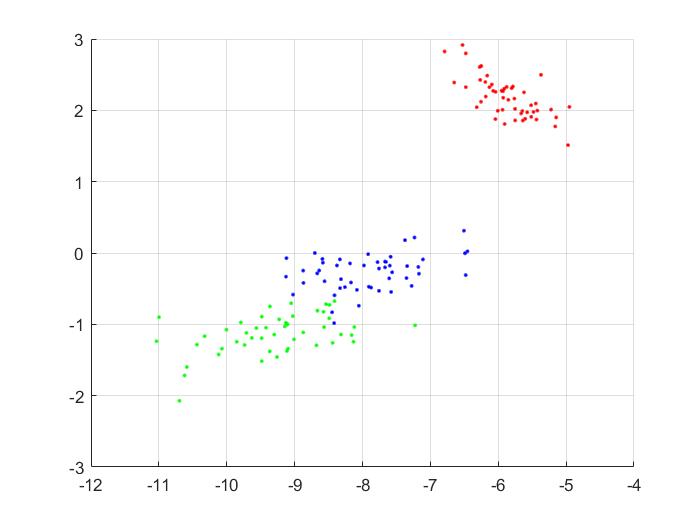
For 2 components:
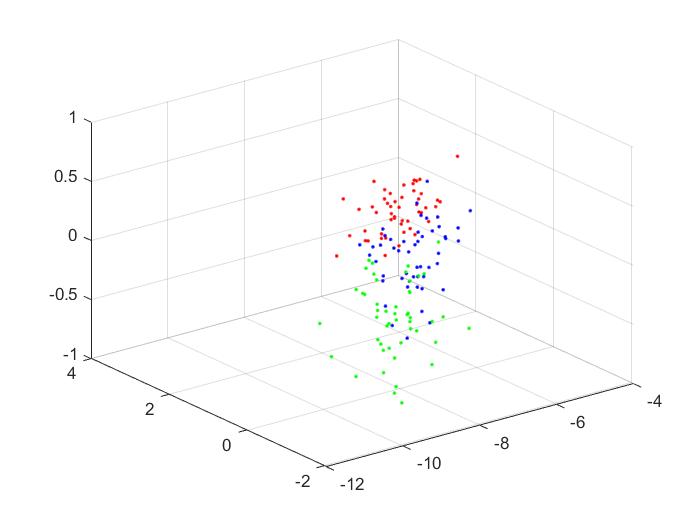
For 3 components:
I also conducted k-means clustering on the reduced data, for 1, 2 and 3 principal components. The clusters are below:
For 1 component:
For 2 components:
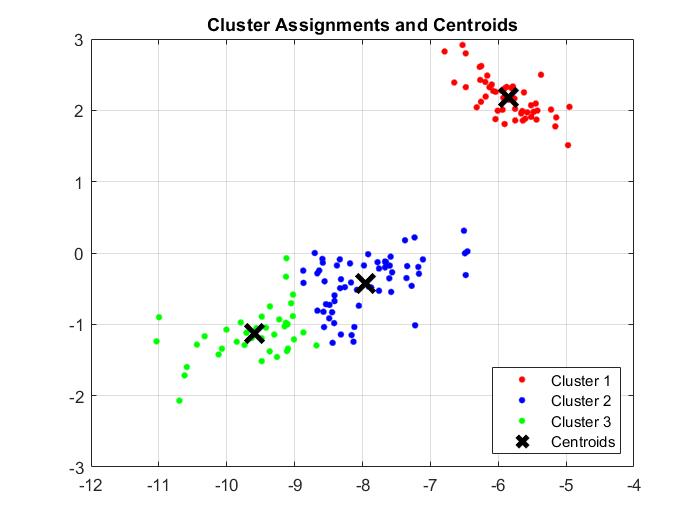
For 3 components:
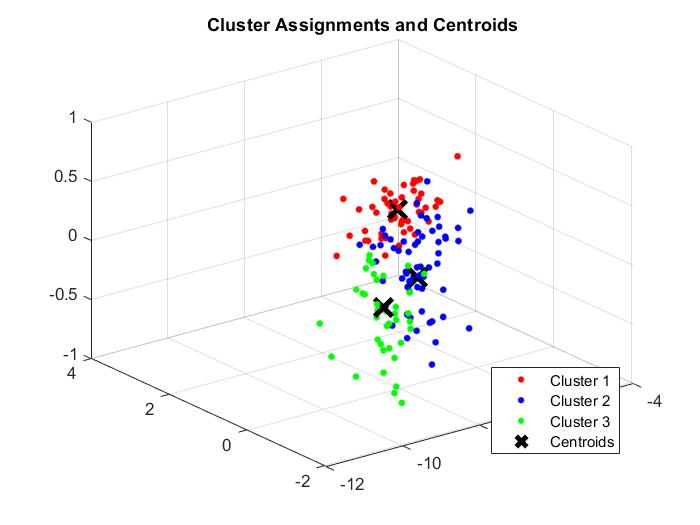
Given the levels of variance explained by each component, I expect the k-means clustering for 2 components to perform much better than the clustering for 1 component. I also expect the clustering for 3 components to be around equal to that of 2 components.
This was indeed the case in the model. Prediction accuracy was only 84% for 1 component, rising to 88.67% for 2 components, and with only a slight rise to 89.3% for 3 components. There was no change between the model with 3 components vs. the model with all components.
Code
The full self written MATLAB code is available on the github page for the project.
Take Aways
-
PCA is a potential way to reduce the size of datasets, as well as remove the impact of multicollinearity within the dataset. However, it can become expensive to perform for large datasets.
-
K-means clustering results are dependent on the rng seed, as different starting cluster locations could lead to different answers.
-
Model accuracy is highly dependent on the most important principal components by singular values. It is important to check these prior to reducing the model.