
Table of Contents
Introduction
For this project, I tackled a classification problem for a provided data set using logistic regression,and conducted a classification on the data using self written gradient descent optimization.
Model
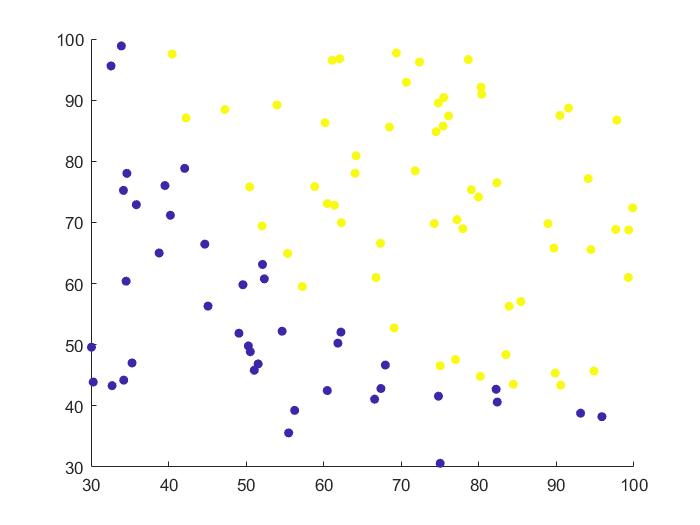
The data provided was split into two categories, denoted in the below graph as blue for 0 and yellow for 1, with arbitrary x and y values.
I first wrote the code for the logistic regression, following which, the regression was iterated over 20,000 times with a learning rate of 0.00001 using the gradient descent method.
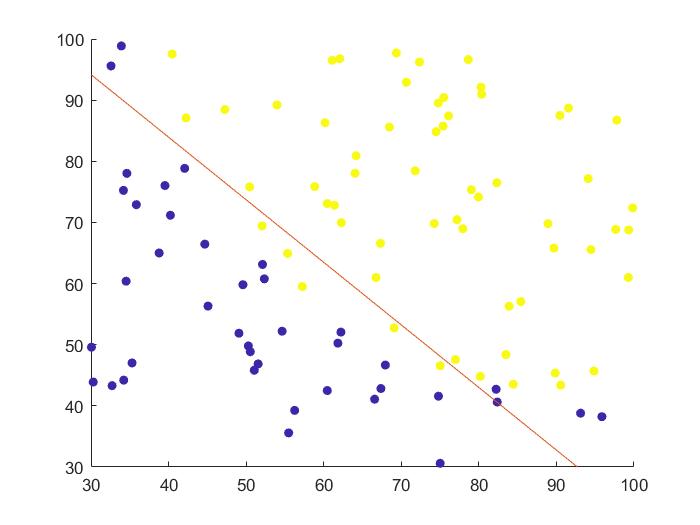
Using gradient descent optimization, and assuming linear boundary, we arrived at the below boundary line which captures the majority of the two classes.
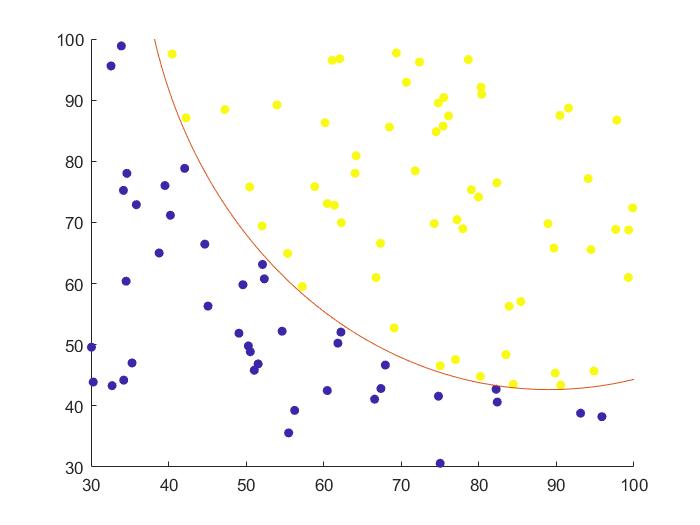
However, I noted that the data seems to show a non-linear boundary, and there exists some non-linear boundary line that will be able to perfectly differentiate between the two classes of data. Post optimization, the new boundary line is as below and captures all points correctly:
Code
The full self written MATLAB code is available on the github page for the project.
Take Aways
-
Classification problems should be tackled via logistics regression. The boundary line can be derived through optimization.
-
In the non-linear boundary, there is some argument that there might be overfitting to the data. This is especially noteworthy at y approx 90-100 and x approx 90-100 respectively. Due to the lack of data points in the region close to the boundary line, there could be an extra amount of curvature to the boundary, which may not necessarily be correct. This problem can be tackled by increasing the number of data points in the training set, especially in regions with high y and low x or high x and low y.